
Keeping you informed about Power BI

Power BI is becoming increasingly popular and is continuing to demonstrate new levels of data connectivity and analysis. However, there are still many organisations that either aren’t aware of the benefits Power BI can bring to them, or do not realise that Professional Advantage offers this tool!
Power BI is a great fit for your finance function and beyond. It is Microsoft’s next generation business analytics tool that can connect to multiple data sources including Infor SunSystems.
As illustrated within Gartner’s Magic Quadrant (an annual market research report published by the IT consulting firm), Microsoft is leading the pack with analytics and BI tools. As a solution tightly integrated with the Office 365 suite, Power BI users are able to leverage their investments in these products to take their data insights to the next level.
Power BI is formed of three main components: Power BI Desktop, Power BI Service, and Power BI Mobile.
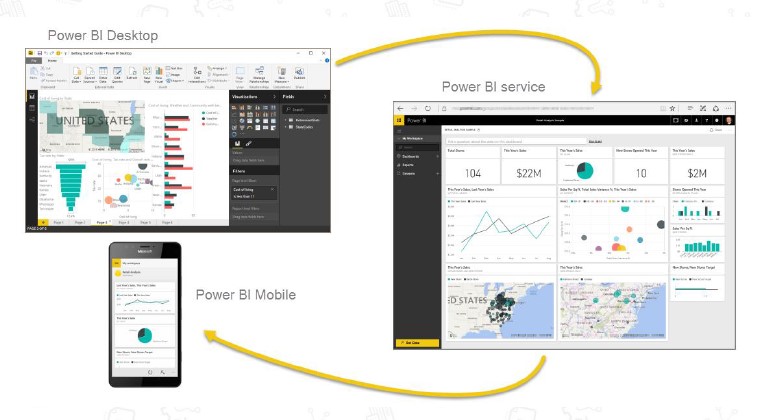
The Power BI Desktop tool is a traditional application best installed from the Microsoft store (Windows 10); installing directly from the Microsoft store is important to ensure automatic updates, as Power BI is updated at least once a month. It is the authoring tool that allows users to design and create end-to-end solutions that can access, transform, and model data.
The Power BI Service allows users to publish, share, and collaborate their reports with other members of the organisation. With reports residing within this Microsoft cloud solution, report consumers and business users have the ability to access and interact with existing visuals, create additional dashboards and visuals, and ultimately self-serve information contained within the reports.
The Power BI Mobile component allows users to access and consume published reports anywhere and anytime using an internet connected smartphone or tablet. All that is required is to install the app from the device app store and log in using your Power BI credentials. Reports can be specifically formatted to suit mobile devices.
When you begin your Power BI journey and log in via the Power BI website with your Office 365 credentials, you will be greeted with a homepage comprising dashboards, reports, workbooks, datasets, and dataflows.
Users can build their own dashboards, selecting the specific elements that are required from the report. They can then choose from the available criteria to determine what data to view (whatever measures have been created can be used as criteria). For example, one may choose from year, sales people, or default.
A set of standard reports can be set up, which can then be used as a template that can be copied, changed, and enhanced based on their own individual preference. You can tailor the reports to what you want to see, changing fields and making edits, and can then transform this data in to various visuals with just one click.
Once a data model is built, you can drag and drop the fields and measures to create your own visualisation, watching as the data changes in front of your eyes.
Power BI Q&A is another feature of Power BI that allows users to explore the data using intuitive natural language questions and receive answers in the form of charts and graphs.
If all of this is whetting your appetite for what Power BI can do, we have even more good news when it comes to implementation!
Power BI is a cost-effective solution from a licensing and implementation perspective. Low subscription pricing and agile development allows users results in quick wins and accelerated deployment.
There really has never been a better time to begin your journey with Power BI!
If you have any questions or would like to know more about what Power BI can add to your organisation, contact your Inside Account Manager.