Latest Episode:

EPISODE 15

In our latest episode of Work Smarter with Data we discussed:

In this Work Smarter with Data episode, we’ll walk through how to use Power BI's Free AppSource Visuals and AI to build custom visuals. We will also road-test Power BI preview features, such as the new Date Picker Slicer (preview feature) and On-object interactions (preview feature). 

In this session, we cover:

  • How to use Power BI Custom Visuals tools.
  • How to leverage AI to generate DAX for Custom Visuals.
  • Leverage the Date Picker Slicer to enhance Time intelligence reporting.
  • Road test the relative and manual Date filter features.
  • Explore the On-object interactions to enhance your Visual development.

EPISODE 14 Machine Learning in Microsoft Fabric: An Introduction

We’ll walk through a practical example using historical sales data to build a forecast that adapts to patterns your spreadsheets can’t easily capture.

EPISODE 13 Choosing the right Power BI Data Connectivity Mode

In this session, we’ll look at how AI-assisted tools can help you edit, automate, document, and manage Power BI reports more efficiently, while still working within familiar development workflows.

EPISODE 12 Handling Inconsistent Data in Power BI: Practical Techniques That Save Time

This Work Smarter with Data session, we will focus on practical Power Query techniques that help Power BI developers handle messy, inconsistent data efficiently.

EPISODE 11 Choosing the right Power BI Data Connectivity Mode

In this month’s Work Smarter with Data session, we will break down the different data connectivity modes in Power BI and explain how your choice can directly impact.

EPISODE 10 Row-Level Security in Power BI

We’re kicking off the 2026 Work Smarter with Data monthly webinar series with a deep dive into Row‑Level Security (RLS) in Power BI.

EPISODE 9 Dynamic Subscriptions in Power BI Reports and Mail Merge with Paginated Reports

This final episode for 2025, we will dive into two features of Power BI: Dynamic Subscriptions for Power BI Reports and Mail Merge with Paginated Reports. These features can help automate report delivery, personalise communications, and reduce manual effort.

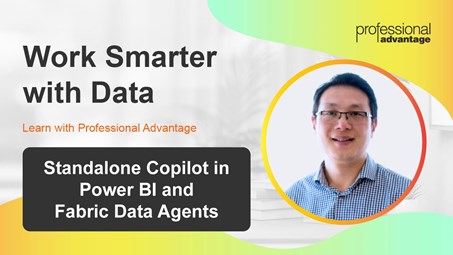
EPISODE 8 Standalone Copilot in Power BI and Fabric Data Agents

In the October session of "Work Smarter with Data," we build on a previous episode of Copilot in Power BI to explore the latest generative AI capabilities in Power BI and Microsoft Fabric, focusing on practical demonstrations and the potential business impact of these tools.

EPISODE 7 Improving Performance in Power BI

This month, Travis Whitehouse, Power BI and Microsoft Fabric consultant, will share tips about data loading, modelling, and DAX that can help optimise Power BI report performance.

EPISODE 6 Translytical Task Flows

Watch the August session of Work Smarter with Data, where our consultants and Power BI users explore the latest updates, discuss common challenges, and share practical solutions to improve reporting and analytics.

EPISODE 5 Data Modelling & Auto-create Report in Power BI

In this session, we share practical and important data modelling concepts that can help lower the burden of model administration, simplify DAX measures, and enhance security options.

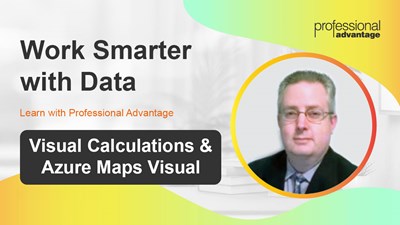
EPISODE 4 Visual Calculations & Azure Maps Visual

Delivered by our Microsoft-certified Data Analytics consultant, Warren Briggs, this session explores Power BI features that can help users reduce some of the DAX overhead with Visual Calculations and build layered geospatial reports with Azure Maps visual.

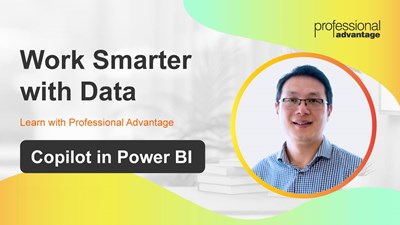
EPISODE 3 Copilot in Power BI

In this session, we explore Microsoft's latest update with a live demo of Copilot in Power BI. See how Copilot can support Power BI developers in creating reports and writing DAX queries, while business users can use natural language to ask questions and uncover insights.

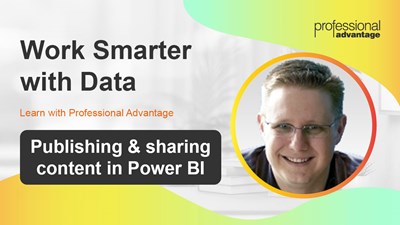
EPISODE 2 Publishing & sharing content in Power BI

Watch this 45-minute session, with senior consultant Travis Whitehouse and discover how to publish and share Power BI content effectively and use the Power BI App experience to deliver tailored insights to different audiences.

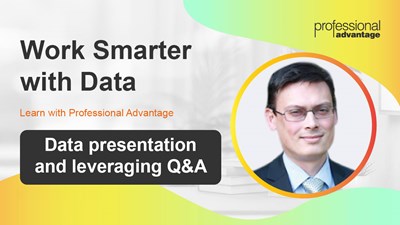
EPISODE 1 Data presentation and leveraging Q&A

Watch the first session of our new monthly online learning series, where we explore new card and filter visualisations, how to use the Q&A feature to make data more accessible for business users, and tips on using tooltips and drill-through to enhance your report canvas.

Is there a particular feature or topic that you would like us to cover at an upcoming session?

Let us know by completing the form below.

Sign up for Free

Work Smarter with Data is a free event. If you can't make it to the live event, we'll send you the recordings.